


Retail Insight: Uncovering The Hidden Cost of Manual Price Labels


The costs of manual price tagging extend far beyond paper and ink. Beneath the surface lies a lengthy operational workflow that consumes valuable personnel hours alongside hidden cost components that frequently escape standard financial audits.
As enterprise SKU counts, store footprints, and promotional frequencies scale, the labor burden and systemic risks multiply – ranging from price discrepancies between shelf displays and Point of Sale (POS) terminals to delayed promotional rollouts and the mounting overhead of supervisory oversight.
Consequently, the core strategic question for modern retail leadership is no longer “What is the cost of printing a single label?” but rather “What are the total resources required to manage pricing updates across the entire retail network?”
This article examines a practical framework for quantifying these expenses across five primary operational pillars:
- Material & Printing Costs include consumables such as paper, ink, stickers, printer usage, and reprints due to damage.
- Labor Costs cover staff working hours for sorting, distribution, installation, and label verification.
- Price Discrepancy Exposure represents the financial risk resulting from variances between shelf labels and POS systems.
- Opportunity Cost represents potential lost revenue due to delayed promotional execution or price changes.
- Management Overhead involves supervisor time allocation for audits, incident handling, and quality control.
The objective is not to establish a single generalized benchmark for all retail environments, but rather to provide a structured methodology for calculating tailored cost estimates using your internal enterprise data.
Why Do Manual Price Tags Appear Deceptively Inexpensive?
Manual price tagging appears deceptively low in cost because expenditures are often evaluated strictly by visible physical materials. Consumables like paper, ink, toner, and adhesive tags are easily tracked through routine purchase invoices and general ledgers.
However, price management does not conclude when a label exits the printer tray. Every price modification initiates an extensive, multi-stage workflow across the store floor, leaving the organization vulnerable to operational risks driven by manual processes that consume staff time and effort.
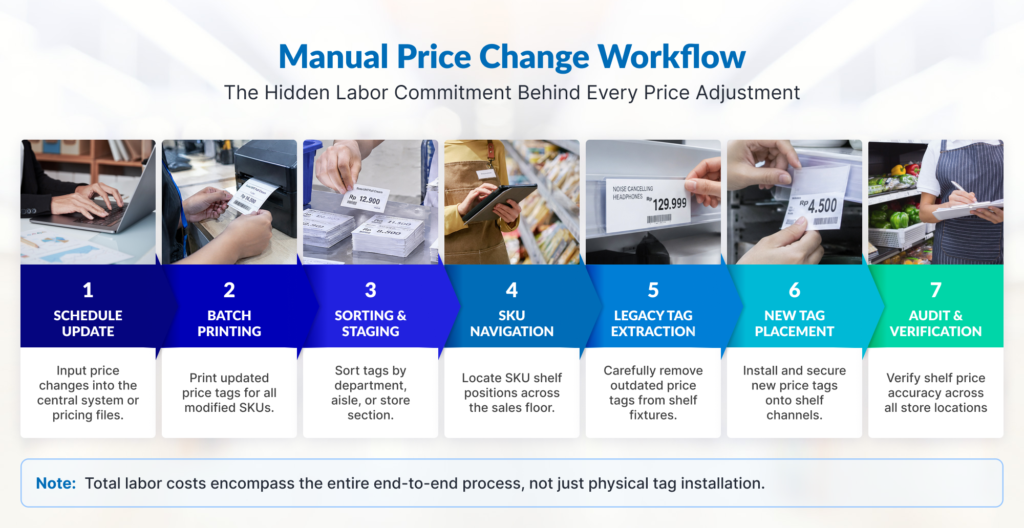
In short: Printing expenses represent only one of five core cost components involved in managing price updates.
Let us examine the operational breakdown and calculation methodologies for each component.
The 5 Cost Components of Manual Price Tagging
To determine the true financial impact of manual price tag management, retail organizations must evaluate five operational areas independently. Each component relies on distinct operational variables and calculation methods.
1. Material and Printing Costs
Material expenses represent the most readily identifiable component because they are recorded directly in procurement ledgers. Nonetheless, evaluating pricing overhead solely through the cost of paper and stickers leads to a severe underestimation.
Beyond primary consumables, auxiliary operational components must be accounted for, including toner or ink consumption, error-driven reprints, label degradation, and hardware maintenance.
Variables Required:
- Active Label Volume: Total unique labels replaced per execution cycle.
- Update Frequency: The number of pricing update cycles executed monthly.
- Unit Material Cost: Combined expense of physical media and printing per label.
- Reprint Rate: Estimated percentage of secondary printing required due to operator errors or damaged tags.
- Outlet Footprint: Total retail units executing the pricing workflow.
- Hardware Amortization: Equipment depreciation expenses (if unbundled from per-label metrics).
Note: Calculations must reflect the volume of labels actively modified, rather than total active SKU catalogs. For instance, an 8,000-SKU enterprise store may only require price adjustments across 3,000 SKUs during a standard promotional transition.
Calculation Formulas
To accurately estimate material expenditures, apply a two-step mathematical model:
- Annual Base Printing Cost =
Label per Cycle × Cycles per Month × Cost per label × 12 months × Outlets
- Total Annual Material Cost (Inclusive of Reprint Rate) =
Base Printing Cost × (1 + Reprint Rate)
Cost Simulation
Assume a regional retail network operating under the following parameters:
- Outlet Footprint: 20 stores
- Modified Labels per Cycle: 3,000 labels per store
- Update Cadence: 2 cycles per month
- Material & Print Cost per Unit: Rp100
- Reprint Waste Rate: 15%
Execution Steps:
1. Base Printing Cost:
3.000 labels × 2 cycles × Rp100 × 12 months × 20 outlets = Rp144.000.000 per year
2. Reprint Waste Allocation:
Rp144,000,000 × 15% = Rp21,600,000
Total Estimated Material & Printing Expenditure: Rp165,600,000 per year
Note: Actual field expenditures frequently exceed this baseline when unallocated printer servicing, thermal printhead replacements, and device depreciation are factored into operational models.
However, keep in mind that this figure represents only the physical printing cost estimation and does not yet account for the complete store-level operational workflow.
2. Staff Labor Costs: The Largest Hidden Expenditure
Although manual tag replacement appears straightforward at a glance, the execution workflow involves extensive operational overhead. The complete sequence encompasses several distinct stages:
- Receiving and reviewing scheduled price change rosters
- Batch printing required tag media at administrative stations
- Segmenting labels by merchandising department or category
- Navigating store aisles to locate specific SKU positions
- Extracting legacy tags manually from shelf channels
- Applying replacement labels with precision
- Conducting secondary verification of shelf-level pricing
Because these responsibilities are included in the standard daily staff schedules, associated labor expenditures rarely surface as dedicated line items in financial reports. Yet every minute of personnel time allocated to physical tagging carries tangible economic value.
Utilize Time Studies, Not Assumptions
The most effective approach for establishing accurate labor costs involves conducting direct empirical time studies in active retail environments.
As an illustration, if field measurements establish an overall median execution benchmark of 2 minutes per label, processing 3,000 labels requires:
3,000 labels × 2 minutes = 6,000 minutes
This equates to 100 working hours per outlet for a single price change cycle.
Granular Activity Distribution Model
Breakdown of the 100 working hours by operational activity:
| Operational Activity | Estimated Time Allocation | Workflow Proportion |
| Schedule staging & batch printing | 10 hours | 10% |
| Departmental sorting & staging | 15 hours | 15% |
| SKU shelf-locating & navigation | 25 hours | 25% |
| Legacy tag extraction | 20 hours | 20% |
| New tag placement & securing | 20 hours | 20% |
| Compliance verification | 10 hours | 10% |
| Total Cycle Labor | 100 hours | 100% |
Note: This time distribution serves as an illustrative benchmark. Actual enterprise results should be derived from direct operational time studies conducted across respective store formats.
Translating Labor Hours into Financial Impact
Applying standard enterprise operational parameters:
- Cycle Labor Investment: 100 hours per cycle per outlet
- Update Frequency: 2 cycles per month (24 annually)
- Network Scale: 20 outlets
- Fully Loaded Labor Rate: Rp50,000 per hour (inclusive of base remuneration, statutory benefits, and payroll overhead)
Calculation Model:
- Total Annual Network Working Hours:
100 hours × 2 cycles × 12 months × 20 outlet = 48.000 working hours per year
- Estimated Annual Labor Expenditure:
48,000 hours × Rp50,000 = Rp2,400,000,000 per year
Why Does This Component Tend to be Overlooked?
Labor expenditures remain obscured because they are absorbed into standard payroll ledgers rather than recognized as direct process waste. Consequently, this time drain generates a substantial opportunity cost.
Rather than being tied down by manual tagging routines, valuable staff hours can be redirected toward revenue-generating and customer-centric activities, such as:
- Providing direct customer assistance and consultative selling
- Accelerating product replenishment across sales shelves
- Executing advanced visual merchandising strategies
- Maintaining store cleanliness and product presentation standards
Optimizing staff working hour allocation represents a primary lever in total cost of ownership (TCO) management.
3. Price Discrepancy Exposure (Shelf vs. POS Variance)
Price discrepancies occurred when shelf-displayed tags unmatched from centralized POS database pricing due to update delays, human execution errors, or data synchronization failures. These variances generally split into two operational scenarios:
- Shelf Price Lower than POS: Triggers customer dissatisfaction at checkouts, queue bottlenecks, transaction interruptions, and mandatory manual supervisor overrides.
- Shelf Price Higher than POS: Risks immediate purchase cancellations on the sales floor or severe brand erosion and margin leakage.
Financial and reputational exposure scales in direct proportion to detection lag, the duration an error persists before identification. High-velocity retail categories face amplified risk, as dozens to hundreds of transactions can process against erroneous pricing before automated or manual audits flag the variance.
Why Retailers Must Monitor This Risk
Beyond direct financial risk, pricing discrepancies expose retail brands to regulatory penalties. In Indonesia, this is governed under Law No. 8 of 1999 on Consumer Protection (UU No. 8/1999), which mandates that business entities present product and pricing information accurately, honestly, and without misleading elements. Furthermore, Ministry of Trade Regulation No. 35/M-DAG/PER/7/2013 explicitly dictates that if a variance arises between shelf displays and electronic cash registers (POS), retailers are legally obligated to honor the lowest displayed price.
Modeling Financial Risk Exposure Due to Price Discrepancies
To measure the financial impact of pricing mismatch, your team will need the key variables below:
- Error Rate: Average pricing errors occurring per store cycle.
- Transaction Exposure: Average transactions processed prior to error detection.
- Price Variance: Average monetary deviation between shelf tags and POS records.
- Update Cadence: Number of price update cycles executed annually.
- Operational Scale: Total outlets executing label updates.
Calculation Formula
Annual Mismatch Exposure = Errors Exposed × Transactions × Average Variance × Cycles per Month× 12 Months × Outlets
Cost Simulation
- Error Incidence: 25 incidents per cycle per outlet
- Transaction Velocity: 4 transactions impacted per incident prior to detection
- Average Variance Value: Rp10,000 deviation
- Update Cadence: 2 cycles per month
- Operational Scale: 20 outlets
Execution Model:
25 incidents × 4 transactions × Rp10,000 × 2 cycles × 12 months × 20 outlets = Rp480,000,000 per year
Note: This figure models potential financial risk exposure rather than confirmed cash losses. Organizations maintaining empirical historical telemetry regarding refunds, POS price corrections, customer compensation, or discrepancy logs should substitute assumptions with internal audit data.
4. Promotional Opportunity Cost From Delayed Commercial Execution
Delays in manual price execution frequently restrict corporate headquarters from launching commercial strategies swiftly, such as flash sales, timed rollouts, or dynamic markdowns. These operational bottlenecks generate measurable opportunity costs: the unrealized revenue that fails to materialize according to commercial projections.
Simulation Methodology
Opportunity Cost = Sales Volume during Delay Window × Estimated Impact Coefficient
Cost Simulation
- Impacted Category Turnover: Rp20,000,000 per hour per outlet
- Execution Latency: 6 hours per promotional event
- Campaign Frequency: 1 event monthly (12 annually)
- Operational Scale: 20 outlets
- Conservative Impact Factor: 5% lost sales realization during lag windows
Execution Model:
1. Gross Revenue During Latency Windows
Rp20,000,000 × 6 hours × 12 months × 20 outlets = Rp28,800,000,000
2. Potential Annual Opportunity Cost (5%)
Rp28,800,000,000 × 5% = Rp1,440,000,000 per year
This metric represents an estimate of potential commercial value lost due to execution delays rather than direct cash write-offs. Because variables depend heavily on transaction volumes, category elasticity, and shopper behavior, opportunity costs should be reported separately from direct operating expenses.
5. Management Overhead and Staff Turnover Impact
Beyond frontline labor allocations, repetitive manual tagging routines contribute to staff fatigue and dissatisfaction, elevating store-level employee turnover. This introduces secondary operational costs, including recruitment, onboarding, and training expenses for replacement personnel.
Additionally, store supervisors must allocate structured working hours toward:
- Inspecting pricing accuracy and conducting shelf sampling audits
- Resolving price dispute escalations at checkout registers
- Re-executing failed price updates and filing incident reports to headquarters
Supervisory Overhead Variables
- Supervision Allocation: Total oversight hours per month per outlet
- Fully Loaded Supervisor Wage: Hourly cost rate for supervisory staff
- Operational Scale & Frequency: Total outlets and update cycles
Cost Simulation
- Supervision Allocation: 5 hours per month per outlet
- Supervisor Wage Rate: Rp75,000 per hour
- Operational Scale: 20 outlets across 12 months
Execution Model:
5 hours × Rp75,000 × 12 months × 20 outlets = Rp90,000,000 per year
Note: This calculation captures direct store-level supervision time only, excluding regional audit oversight or central pricing desk support.
Staff Turnover: Should It Be Calculated?
Repetitive manual tasks, promotional workload surges, and irregular shifts can negatively affect staff retention. However, a direct causal link between manual label management and employee turnover should not be assumed without robust internal telemetry.
When organizations incorporate turnover variables into TCO analyses, empirical internal metrics must be applied, such as:
- Departmental turnover rates and exit interview findings
- Recruitment and onboarding expenditures
- Overtime compensation and temporary staffing costs
Turnover impact should only be integrated into financial models when supported by verifiable internal data.
Avoid Miscalculation: Categorizing Cost Components Proportionally
A frequent error in manual pricing evaluations involves treating all financial metrics as homogeneous expense types. To ensure precision, financial controllers should categorize expenditures into three core pillars:
1. Direct Operating Cost
Direct cash expenditures consuming operational resources that remain relatively simple to measure, including:
- Material and printing expenses
- Staff working hour wages
- Supervisor oversight time
- Printer maintenance and upkeep
2. Financial Risk Exposure
Potential monetary values carrying exposure to loss resulting from field operational errors:
- Price variances between shelves and POS databases
- Cashier transaction corrections
- Customer refunds and compensation payouts
- Undetected pricing errors
3. Opportunity Cost
Economic value potentially lost or unrealized due to operational delays and manual workflow limitations:
- Delayed promotional rollouts
- Extended price change execution windows
- Friction in executing time-sensitive commercial strategies (such as flash sales)
Important Note: These three categories are highly effective when analyzed in tandem to comprehend Total Cost of Ownership (TCO). However, they must not be raw-summed without structural context and claimed as total net company losses.
Case Study Summary: 20-Outlet Retail Network Model
To understand how expenses accumulate across a regional retail network, consider the following simulation for an enterprise operating 20 outlets:
1. Direct Operating Cost (OpEx)
- Material & Printing: Rp165,600,000
- Store Staff Labor: Rp2,400,000,000
- Supervisory Oversight: Rp90,000,000
Total Direct Operating Expenditure: Rp2,655,600,000 per year
2. Financial Risk Exposure
Estimated Price Discrepancy Risk: Rp480,000,000 per year
Combined Operating Expenditure & Risk:
Rp2.655.600.000 + Rp480.000.000 = Rp3.135.600.000 per year
3. Opportunity Cost (Reported Separately)
Potential Delayed Revenue: Rp1,440,000,000 per year
Operational Expense Composition
Comparing operating expenditures against risk exposure reveals a striking distribution:
- Store Staff Labor: ±77%
- Price Discrepancy Exposure: ±15%
- Material & Printing: ±5%
- Supervisor Oversight: ±3%
What Insight Is Derived From This Telemetry?
Paper and ink consumables account for a mere 5% of total expenditures. Hence, evaluating pricing overhead solely through procurement invoices introduces a 95% blind spot regarding true operational burdens.
Optimize Your Retail Investment Through Empirical Operational Data
Every retail enterprise maintains a unique cost structure, SKU volume, promotional frequency, and baseline productivity level. Consequently, the simulations within this analysis function as a calculation framework rather than a fixed operational benchmark.
Enterprise operations and finance teams can evaluate custom TCO estimates using internal corporate data via the following resource:
Get Access to The TCO Calculation Worksheet
Tips for Obtaining An Accurate Time Study Data
To achieve analytical precision, operational teams should execute direct in-store measurements across five structured steps:
1. Select a Representative Label Sample
Measure a minimum of 20 SKUs across diverse floor zones (standard shelving, promotional endcaps, high-density categories). Track total elapsed time across the complete workflow; from schedule receipt, batch printing, sorting, floor navigation, extraction, insertion, to final verification.
2. Utilize Median Values (Do Not Average Numbers)
Arithmetic averages skew heavily toward operational outliers (e.g., misplaced stock or hard-to-reach fixtures). Median benchmarks establish a statistically stable baseline.
3. Segment Operational Baselines
Separate standard operating days from promotional periods. Peak promotional events exhibit severe volume spikes, complex sorting matrices, and heightened overtime exposure.
4. Integrate ERP & POS Master Data
Cross-reference physical findings with historical enterprise data, tracking actual price change volumes, overtime trends, register overrides, and refund logs.
5. Audit Mismatch Rates
Apply standard operational auditing formulas:
Price Error Rate = Verified Price Discrepancies / Total Shelf Prices Audited
Track detection lag durations to model enterprise financial exposure accurately.
Cost Structure Comparison: Manual Paper Tags vs. Electronic Shelf Labels (ESL)
Transitioning to an Electronic Shelf Label (ESL) infrastructure does not completely eliminate operational overhead; rather, it restructures financial commitments from recurring, labor-heavy operational expenditures (OpEx) to centralized capital investments (CapEx).
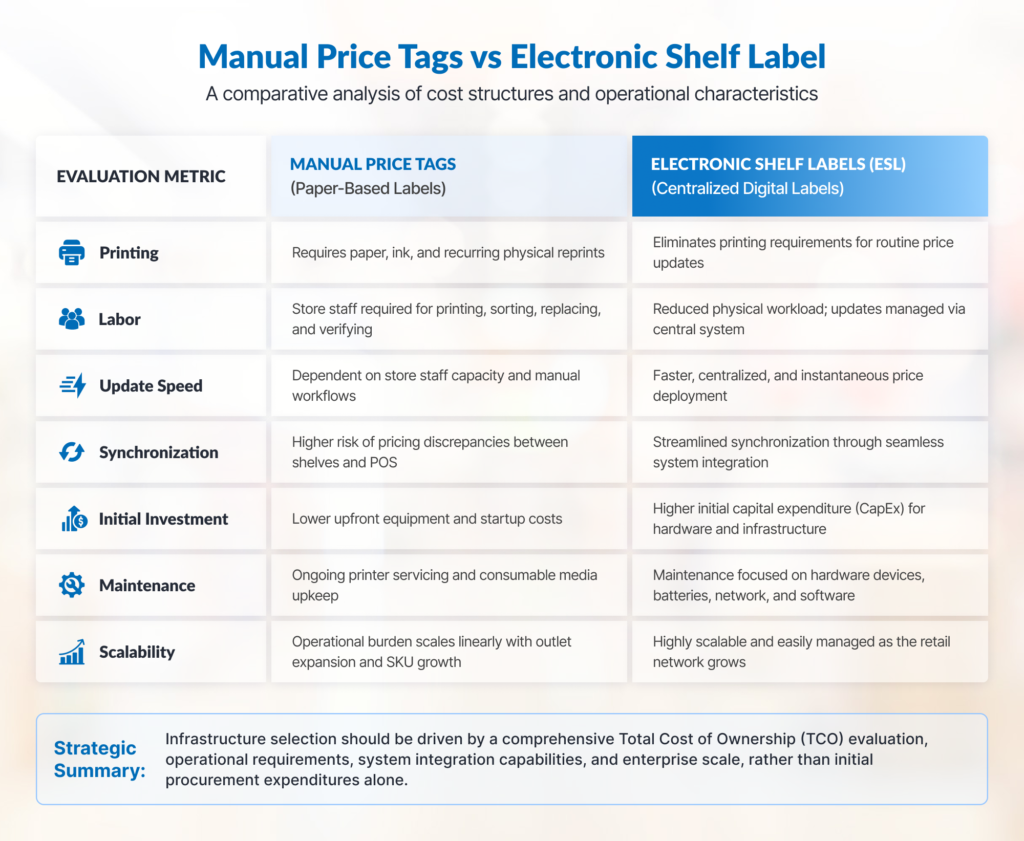
Prior to vendor selection, retailers should execute a Total Cost of Ownership (TCO) assessment to identify the optimal long-term solution over a 3-to-5-year period, moving beyond initial capital expenditures.
Enterprise Diagnostic: Is Manual Pricing Limiting Your Growth?
Assess organizational readiness for infrastructure modernization by auditing the following operational indicators:
[ ] Routine price updates consistently trigger store-level overtime or scheduled shift extensions.
[ ] Commercial promotional campaigns experience frequent launch delays due to labeling backlogs.
[ ] Store personnel allocate excessive weekly hours to administrative printing and tag placement.
[ ] Shelf-to-POS price discrepancies generate recurring customer service friction at checkouts.
[ ] Store managers and supervisors report heavy time commitments dedicated to pricing audits.
[ ] Central headquarters struggles to enforce synchronized price updates across geographically dispersed outlets.
[ ] Price change volumes scale upward alongside enterprise SKU expansion and new store openings.
[ ] Time-sensitive dynamic pricing or happy-hour markdowns remain operationally unfeasible.
[ ] New store integration introduces disproportionate administrative burdens on pricing management.
[ ] Enterprise systems lack real-time network visibility into store-level price update compliance.
If your organization validates 3 or more of these operational friction points, your current pricing infrastructure warrants an immediate TCO-based evaluation.
Frequently Asked Questions (FAQ)
How long does it take to replace a single price tag?
There is no single absolute baseline that applies to all retail store in general. The exact duration depends heavily on store layout, SKU location, tag type, printing workflow, physical distance between sections, and verification procedures.
In this article’s calculation model, we use a median benchmark of 2 minutes per label as a reference point. The best approach to determine your store’s baseline is to conduct a time study across a sample of at least 20 labels on the sales floor, using the median result as your operational baseline.
What are the hidden cost components in manual price management?
Beyond direct physical expenditures for paper and ink, enterprises must account for key hidden cost elements, including:
- Floor staff labor allocation
- Reprint rates driven by damaged or misprinted tags
- Supervisor audit and oversight hours
- Checkout line price overrides and discrepancy adjustments
- Overtime wage expenditures
- Delayed promotional execution (opportunity cost)
Note: Because not all items represent direct cash outlays, costs should be categorized into Direct Operating Costs, Financial Risk Exposure, and Opportunity Costs.
How do you calculate the total labor cost for price tag replacement?
Labor expenditures are calculated using a two-step formula framework:
1. Total Labor Hours Calculation:
Total Hours= ( Total Labels × Median Duration (minutes) ) / 60
2. Total Annual Labor Cost Calculation:
Total Labor Cost = Total Labor Hours × Fully-Loaded Hourly Staff Rate
Note: The fully-loaded hourly rate should reflect the true, fully burdened cost per staff working hour (including baseline salary, benefits, allowances, and statutory insurance), rather than basic compensation alone.
How can a retailer measure the financial impact of price discrepancies?
Replace generalized assumptions with actual enterprise internal data, specifically:
- Total historical frequency of price discrepancy incidents
- Average transaction volume occurring prior to error detection (detection lag)
- Average price variance between shelf labels and POS registers
- Historical refund logs and cashier override records
The more complete your historical baseline data, the higher the precision of your financial risk calculations.
Do manual tagging costs scale linearly with store network expansion?
In manual physical processes, expanding the store footprint generally drives a proportional increase in overall operational workload; however, cost scaling is rarely strictly linear.
Variations in staff productivity, SKU density, store formats, promotional cadence, and labor allocation differ across locations. Therefore, expansion-driven cost escalation should be evaluated on a per-format operational profile basis.
When should an enterprise evaluate Electronic Shelf Labels (ESL)?
An ESL infrastructure investment is highly compelling when several operational indicators emerge concurrently, such as:
- High volume and frequency of price updates and promotional cycles
- Rapid store network and geographic footprint expansion
- Escalating labor cost allocation dedicated to shelf-level price updates
- Centralized pricing synchronization becoming a strategic priority
- Operational constraints in executing manual dynamic pricing strategies
Ultimately, any capital allocation decision should be anchored in a comparative Total Cost of Ownership (TCO) evaluation, system integration compatibility, and estimated ROI payback period.
Conclusion: Establish Your Enterprise Operational Baseline
Manual price tags maintain a superficial illusion of economy simply because consumable procurement invoices are easily tracked. In reality, enterprise capital is heavily drained by wasted labor hours, supervisory oversight overhead, margin leakage from price variances, and delayed commercial execution.
Before committing to infrastructure modernization, enterprise leadership must accurately measure their current store-level operational baseline. Consolidating empirical data regarding true labor allocation, print waste, supervisory audits, and discrepancy frequencies provides the foundational clarity required to optimize enterprise retail operations.
Optimize Your Retail Efficiency with a Tailored Operational Model
Want to uncover hidden pricing costs across your store network? Contact our team today with your store footprint, estimated SKU volumes, and promotional cadence to receive a customized TCO operational analysis for your business.